| Quick Options Show Actual Arrival Times Show Actual Arrival Spread Change Statistic: RT 5L 10L 15L 20L Cht Hide Likely Worst Experience |
| TOC Filter: Show All Show Daily Summary Hide Arrival Graph Show % Service that Ran More... |
Search Results
Jump To: Arrival Graph
The table below lists all train services departing London Euston (d EUS) and arriving in Birmingham New Street (a BHM) for the specified time period. Also shown is the percentage of the time that each service arrived in Birmingham New Street no more than 2 minutes late, as well as the average arrival time of each service in Birmingham New Street. To see actual times click here.
| TOC | Scheduled Times | % Arrivals | Likely | Actual Arrival | ||
|---|---|---|---|---|---|---|
| d EUS | a BHM | Dur | RT-2m late | Worst Exp. | Average | |
| LM | *21:31 | 00:15 | 2h 44m | 100% | 00:15 RT | 00:15 RT |
| LM | *21:50 | 00:22 | 2h 32m | 75% | 00:24 2½L | 00:23 1½L |
| LM | *21:50 | 00:23 | 2h 33m | 85% | 00:24 1L | 00:26 3½L |
| LM | 05:35 | 08:14 | 2h 39m | 53% | 08:18 4L | 08:22 8½L |
| LM | 06:21 | 08:44 | 2h 23m | 74% | 08:52 8½L | 08:54 10½L |
| LM | 07:23 | 09:45 | 2h 22m | 63% | 09:52 7L | 09:53 8L |
| LM | 07:56 | 10:14 | 2h 18m | 55% | 10:23 9L | 10:23 9L |
| LM | 08:23 | 10:44 | 2h 21m | 68% | 10:48 4L | 10:48 4½L |
| LM | 08:56 | 11:14 | 2h 18m | 79% | 11:16 2L | 11:15 1L |
| LM | 09:23 | 11:44 | 2h 21m | 84% | 11:45 1L | 11:47 3½L |
| LM | 09:56 | 12:14 | 2h 18m | 63% | 12:21 7L | 12:17 3½L |
| LM | 10:23 | 12:44 | 2h 21m | 74% | 12:48 4½L | 12:51 7½L |
| LM | 10:56 | 13:14 | 2h 18m | 74% | 13:17 3½L | 13:18 4½L |
| LM | 11:23 | 13:45 | 2h 22m | 84% | 13:45 RT | 13:51 6½L |
| LM | 11:56 | 14:14 | 2h 18m | 79% | 14:15 1½L | 14:20 6½L |
| LM | 12:23 | 14:44 | 2h 21m | 79% | 14:47 3L | 14:51 7L |
| LM | 12:56 | 15:14 | 2h 18m | 58% | 15:26 12L | 15:25 11½L |
| LM | 13:23 | 15:44 | 2h 21m | 68% | 15:57 13½L | 15:53 9½L |
| LM | 13:56 | 16:14 | 2h 18m | 68% | 16:17 3L | 16:21 7L |
| LM | 14:23 | 16:44 | 2h 21m | 63% | 16:50 6½L | 16:51 7½L |
| LM | 14:56 | 17:14 | 2h 18m | 58% | 18:03 49L | 17:31 17L |
| LM | 15:23 | 17:45 | 2h 22m | 74% | 17:58 13½L | 17:56 11½L |
| LM | 15:56 | 18:14 | 2h 18m | 58% | 18:27 13½L | 18:26 12L |
| LM | 16:26 | 18:42 | 2h 16m | 100% | 18:42 RT | |
| LM | 16:26 | 18:45 | 2h 19m | 61% | 18:52 7L | 18:53 8½L |
| LM | 16:56 | 19:14 | 2h 18m | 71% | 19:23 9½L | 19:21 7½L |
| LM | 16:56 | 19:15 | 2h 19m | 50% | 19:18 3½L | 19:18 3L |
| LM | 17:26 | 19:42 | 2h 16m | 50% | 19:45 3L | 19:45 3L |
| LM | 17:26 | 19:45 | 2h 19m | 88% | 19:47 2L | 19:47 2L |
| LM | 17:56 | 20:13 | 2h 17m | 42% | 20:23 10½L | 20:23 10½L |
| LM | 10:52 | 20:16 | 9h 24m | 0% | 20:19 3L | |
| LM | 18:26 | 20:45 | 2h 19m | 79% | 20:47 2L | 20:51 6½L |
| LM | 18:56 | 21:14 | 2h 18m | 74% | 21:20 6½L | 21:18 4½L |
| LM | 19:23 | 21:45 | 2h 22m | 37% | 21:54 9½L | 21:53 8L |
| LM | 19:56 | 22:15 | 2h 19m | 29% | 22:23 8½L | 22:20 5L |
| LM | 19:56 | 22:18 | 2h 22m | 50% | 22:21 3½L | 22:21 3L |
| LM | 20:23 | 22:43 | 2h 20m | 72% | 22:47 4½L | 22:45 2½L |
| LM | 20:23 | 22:45 | 2h 22m | 100% | 22:45 RT | |
| LM | 20:56 | 23:24 | 2h 28m | 84% | 23:24 RT | 23:27 3½L |
Show Explanation Show TOC and Timings Keys
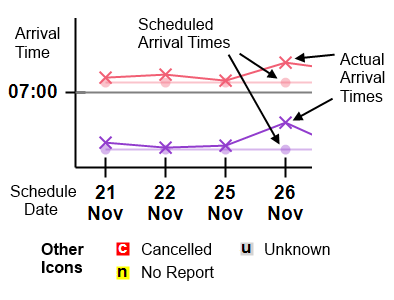
Actual Arrival Time Graph
The chart below shows the actual arrival times for the services detailed above. Click on the chart to open an enlarged version.

Data Completeness
Data is present for all 504 hours in the time period being searched.
Summary
598 services have been found, of which 0 services have been discarded due to incomplete data.
Grouping has resulted in 39 schedules, of which 0 schedules (= 0 services) have been hidden as specified in the search criteria.
All 39 schedules (= 598 services) are displayed above.
Data reflects train services up to: 07:21 on Fri 3 May 2024.
Options
Another Search?
Amend the criteria above to search again or open a new window (to start a new search whilst retaining these results).
Data Source and Validity
The information shown on Recent Train Times is sourced from Network Rail via their Open Data Feeds, augmented with additional data sourced from the Rail Delivery Group via their Darwin system.
Recent Train Times is not part of Network Rail or the Rail Delivery Group and is not an official rail industry body. Nor is Recent Train Times a source of official rail performance information / statistics.
For official rail performance information, please see Office of Rail Regulation, Network Rail, UK National Statistics and Gov.uk.